You are here
Net Income
Net income metric is derived from incomes and costs of production (variable and fixed or overhead costs). Costs of production includes variable and fixed costs of production such as labor, fertilizers, seed, feed costs etc. plus non-cash expenses that might include annual depreciation of equipment such as a tractor. Depreciation is added to the net income calculation because for long term profitability, the farmer must be able to replace the equipment once it wears out. In addition, interest paid on loans for the business should be added to the expenses (costs). When considering the decision to adopt a technology, a farmer examines whether there are additional net gains from the technology or innovation (for brevity innovation and technology will be used interchangeably).
How to operationalize the metric
Method of data collection and data needed to compute the method:
The approach to calculating net income at the field level is described below. Data to calculate net income of a technology is usually collected by survey. Recall surveys and or diaries are used to enter data on the input costs, management, and income from output. Cost (price per unit of input) and quantity of inputs used in the production process are critical data. Standardized units such as kilograms or liters should be used.
From the survey it is recommended (but not limited to) to collect data on;
- Quantity of inputs used in production (inorganic fertilizer, pesticides, labor, feed)
- Price of each input above (used to calculate the cost of each input)
- Other costs (cost of veterinary services, transportation costs, cost of vaccines, breeding fees)
- Quantity and price for output (for example; price of milk and amount produced)
- Fixed costs that may include
- Housing (farm house for animal or crop production)
- Land rent
- Beginning stock (for animal production)
- Depreciation
- Taxes or interest
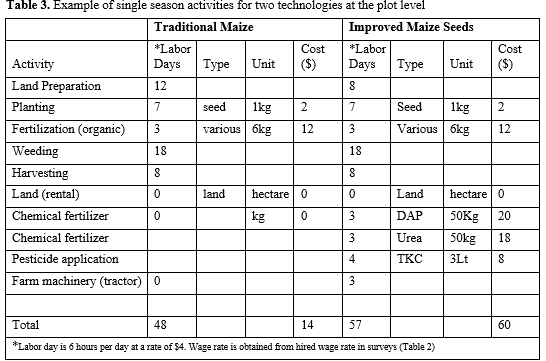
Standard surveys may not collect all this information but it is advisable to adjust the survey tool to meet the needs for calculating the metric. In Table 3 we provide an example in which the net income metric is calculated for the new maize technology.
(Adaptation from Avila, 2016: http://fisheries.tamu.edu/files/2013/09/SRAC-Publication-No.-4402-Determining-the-Profitability-of-an-Aquaculture-Business-Using-Income-Statements-and-Enterprise-Budgets.pdf
Also see - http://classes.arec.wsu.edu/EconS450/Spring2011/docs/Understanding%20Profitability.pdf )
In Table 3, the costs of production for two technologies, traditional maize and improved maize are listed. These can be collected from an Agricultural Survey. It is important to note the cost of labor is an important input for this calculation and enumerating the wage rate of labor is important. For small plot experiments where the farmer works on his own plot, the wage rate may be difficult to obtain but this data can be inferred from the going daily wage for hired labor in that area. For example, if the household hires an extra laborer at $4 per day, this may be used as the going wage rate. In comprehensive surveys such as the LSMS-ISA surveys, the labor section inquires about wage rate for hired labor. Where this wage rate is noted, this amount can be used. In our example above, a wage rate of $4 is the going rate3. The total cost of inputs other than labor are calculated (Table 1) from the data collected in the survey. Please note that total area (in acres or hectares) to which this technology is applied is important as well as the total cost of each input used.
 _____________________________________________________________________________
1 The labor wage rate in most developing countries may be difficult to assess due to lack of quality data or missing labor markets. Caution should be taken to ensure that enumeration of the wage rate does not under or overestimate the returns to labor.
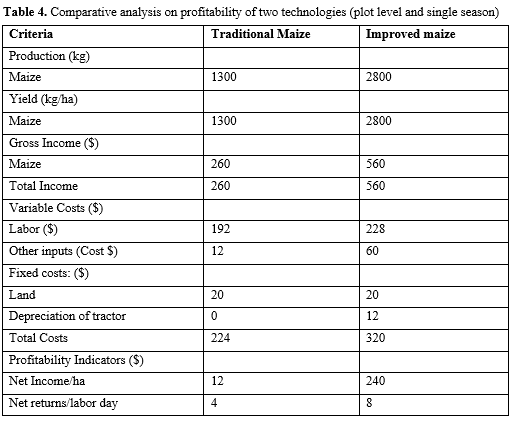
In Table 3 (See Appendix) the total production and value of production (in $ given the price of $0.2 per Kilogram) is calculated. The area planted for simplicity was one hectare for each technology. The variable costs are cost of labor and other commercial inputs such as chemical fertilizers, pesticides, e.t.c. (see Table 2 in Appendix), the fixed costs are the cost of land and depreciation of the tractor ($12) (for a tractor costing $120 to be used for 10 years with no ($0) salvage value). Net income is calculated as the difference between the total income and total costs (equation 1 below) and the returns to labor are calculated using equation (2). (See Avila, 2016; Engle, 2012).
Standard survey questions used to collect such data can be found in the living Standards Measurement Study - Integrated Surveys on Agriculture (LSMS-ISA) surveys sections 3,4,5, 10 and 11 (http://siteresources.worldbank.org/INTLSMS/Resources/3358986-1233781970982/5800988-1286190918867/NPS_Agriculture_Qx_English_(Year2)_v2.pdf ).
Unit of analysis:
The unit of measurement is the net income per hectare. For data over as season or agricultural year (not multiple year), we assume the net income should be examined as
Gross income is the value of amount of produce sold (quantity sold *price) and total cost is the sum of the variable costs and fixed of overhead costs (cost of labor + seeds + chemical fertilizer + Land + depreciation of tractor…).
This may be used to compare between two technologies to assess which one performs better than the other.
Limitations regarding estimating and interpreting:
This indicator has a number of limitations. Estimation the net income requires computation of overhead or fixed costs. In case of technology investments that cover more than one year, these calculations may require some economic or accounting knowledge to estimate. This measure also requires more data than the gross margin metric which may limit its usage where data is a limiting factor. Also unlike benefit cost analysis, some of the non-cash benefits may not be considered this analysis. In cases where these are needed for decision making the benefit cost analysis is recommended. where Measuring profitability using the net income metric may require estimation of the opportunity cost of labor or the wage rates of labor which might be difficult to obtain at field level of in areas where labor markets are missing or incomplete. Secondly, depending on the time horizon of the project, there is need to incorporate sensitivity analysis of the project given various price scenarios and also looking at the internal rate of return for the project is very useful. These measures might require more expertise but are essential in explaining potential long run adoption of the technology. Because of the limitations in assessing profitability of a given technology across scale, alternative measurement method such as gross margin or participatory evaluation may be considered.