You are here
Remotely Sensed Measures of Crop Productivity
Remote sensing can be used to measure vegetation indices and productivity across landscapes through spectral signals and multi-input algorithms. One well known index is the Normalized Difference Vegetation Index (NDVI), which has the following formula: NDVI = (NIR−R) / (NIR+R), where NIR is Near Infra-Red and R is Red. NDVI can be used to measure crop greenness, i.e., vegetation density and health, across both spatial and temporal scales. Another, Net Primary Productivity (NPP), is a multi-input modeled product that estimates kilograms of carbon per square meter. Measures of carbon per unit area, in combination with harvest indices, can be used for direct conversion to plant biomass (i.e., yield). Another more complex method is to use crop models to estimate yield given the remotely-sensed leaf area index (LAI) estimates over the growing season (Lobell, 2013).
How to operationalize the metric
Method of data collection and data needed to compute the method:
The two most commonly used sources of remotely sensed agricultural data are from U.S. government funded satellites—LANDSAT (managed by USGS) and MODIS (managed by NASA).
LANDSAT provides fine resolution images (30-m by 30-m pixels) at 8-day intervals from 1972 and are released about 24 hours after acquisition (USGS, no date) from the following website: https://landsat.usgs.gov/landsat-level-1-standard-data-products. This resolution makes it possible to detect fields that are roughly 1 ha or larger (Lobell 2013). To calculate NDVI it would be necessary to download the near infrared (band 4 of Landsat 7) and red wavelengths (band 3 of Landsat 7).
MODIS (Moderate Resolution Imaging Spectroradiometer) provides coarse resolution images (250-m to 1-km) of the earth surface every 1 to 2 days (commonly composited into 8- or 16-day intervals), starting from 1999. Reeves et al. (2005) used MODIS GPP data to estimate wheat yields in the US and found it accurate for estimating state level production. Peng et al. (2014) used MODIS NPP data to estimate paddy rice yields in China by complementing the remote sensing with field visits. Messina et al. (2017) used Net Photosynthesis (PsnNet), a derivative of Gross Primary Productivity (GPP), to evaluate crop productivity in the Malawian smallholder farming context.
The data from these satellites can be downloaded as raster structure data, which can then be manipulated using free GIS software such as QGIS, GRASS GIS, or the statistical software R. One R tutorial on raster structure data can be found here (https://geoscripting-wur.github.io/IntroToRaster/).
Unit of analysis:
The unit of analysis is the area of interest, with a lower limit being set by the resolution of the image, which determines the dimensions of each pixel detected.
Limitations regarding estimating and interpreting:
Inferring from remote sensing to estimate grain production from agricultural landscapes can be difficult, especially where small plot sizes create a diverse mosaic of crops and management practices within the smallest spatial resolution of the satellite image. Many sources of remote sensing have images with a resolution around 30 to 100meters, whereas yield variation is generally at a 1- to 10-meter resolution.
This limitation can be overcome using commercial satellites, planes, or drones. Lobell (2013) states, “new commercial systems are delivering even higher spatial resolution (5-m × 5-m or finer) at costs that are approaching 1 USD$ per km2 (or $0.01 per ha)”.
Shortcomings common to all crop productivity metrics regarding estimation and interpretation
The inference zone is important to consider for all crop productivity metrics. On-farm measurements, and farmer qualitative data may be influenced by local conditions and culture, thus extrapolation from this information needs to be carefully considered.
The quality of production is often important and this can be difficult to account for in a quantitative measure of kilograms per hectare. One approach is to compare production for similar quality of product from the same species (for example dividing potato production into market grades). Fodder quality assessment is described in the “Crop residue productivity” section below.
Relative differences in productivity are even more complex to measure when multiple crops are produced on the same field. In some cases, the production of all crops can be compared in terms of the monetary value of production (which relates to income, an indicator in the economic domain) or their nutritional value (calories, protein, etc.), which is an indicator in the human condition domain. More often it is necessary to report production separately for each of the different types of plants. Productivity of intercropping is typically compared to monocropping through a calculation known as the land equivalent ratio (Mead and Willey, 1980):
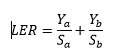
Where Ya is the intercropped yield of crop A, Sa is the sole crop yield of crop A, Yb is the intercropped yield of crop B and Sb is the sole crop yield of crop B. A LER of 1.2 means that it would take 1.2 hectares of sole crops to produce the same amount as 1 hectare of the intercrops.
Comparisons of productivity of the land at the farm or landscape level requires aggregating across crops (e.g. cotton vs. maize). This aggregation must convert the production of each crop into a common unit that is meaningful for farmer decision-making (such as local currency, calories, or protein). Alternatively, farmers’ subjective valuation of each crop could be used to assign weights to each species. This may be particularly useful if a large portion of the crops are not sold.
Further reading on additional methods for estimating crop productivity are available from the CCAFS SAMPLES website (http://samples.ccafs.cgiar.org/measurement-methods/chapter-8-yield-estimation-of-food-and-non-food-crops-in-smallholder-production-systems/) which is also available as a book chapter (Sapkota et al. 2016).