You are here
Food Consumption Score
The food consumption score is used to examine prevalence of food security. It uses data from dietary diversity and household food access over a seven-day recall period. This indicator has been widely used by the World Food Program (WFP, 2008; Jones et al., 2013). The diversity of consumption is analyzed across a given number of food groups, normally eight, with assigned weights. Modification to the weights may be done depending on the objective of the study and the context (WFP, 2015). Such modification may be done in consultation with an expert in this field.
How to operationalize the metric
Method of data collection and data needed to compute the method:
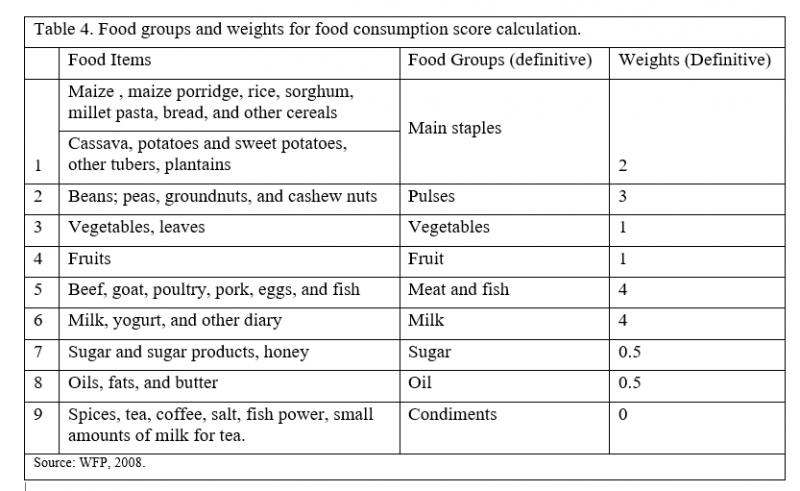
Data for calculating the food consumption score is collected at the household level using a survey. A seven-day recall is period is used to enumerate the number of times the household consumed a given food. A list of items per food group should be provided. In addition, standard weights are available (see Table X), but there are methods in the literature that are available if the researcher would like to compute custom own weights (WFP, 2008). The calculation steps for the food consumption score are as follows (WFP, 2008):
- Using the food frequency data, group all food items into their specific groups (see Table X)
- Sum the consumption frequencies of the food items in the same group and recode the values of each group greater than 7 as 7.
- Multiply the frequencies obtained in step 2 for each group by the weight (see Table X) to obtain the weighted food group score.
- Sum the weighted food group scores, which provides the food consumption score for the households.
- Use the appropriate thresholds to classify the households (see the unit of analysis section for metric 6)
Unit of analysis:
The food consumption score normally groups the households’ food security using the following thresholds for the score:
- Poor, from 0-21,
- Borderline, between 21.5 – 35
- Acceptable for a score greater than 35.
A poor score may imply that the household is falling short of consuming at least one staple food or vegetable in the week, while the acceptable score is based on the consumption of oil and pulses in addition to staples and vegetables (Jones et al., 2013; WFP, 2008; Weismann et al., 2009).
Limitations regarding estimating and interpreting:
The measure is easy to administer and where standardized weights and cutoffs are used, the results may be compared across groups. But the cut off points should be examined depending on the context to ensure differentiation between household in that location. In areas where almost every household consumes a particular group such as sugar and oil, the cutoffs should be adjusted to ensure correct assessment of the performance of households in that area (Jones et al. 2013).